In this tutorial we are planning to explain step by step on how to record HTTP/HTTPS sessions.
Setup Instructions
- Go to JMETER_HOME/bin and start JMETER with jmeterw.cmd and jmeter in linux/unix.
- Select “Test Plan”, right click on “Test Plan” and add a new thread group: Add > Threads (Users) > Thread Group.

3. Select “Thread Group” right click, “Add –> Config Element –> HTTP Request Defaults”

4. In new HTTP Request Defaults element: Server name – enter “host to be tested”, path can be left blank.

5. Right click on the “Thread Group” and add a recording controller: Add > Logic Controller >Recording Controller.

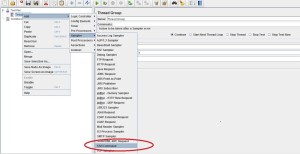
6. Next, select WorkBench, Right click on WorkBench and add the recorder: Add -> Non-Test Elements -> HTTP(S) Test Script Recorder

7. On HTTP(S) Test Script Recorder, click the “Add” button in “URL Patterns to Include”. This will create a blank entry; enter “.*.html”. you can specify URL patterns to include and exclude such as *.html, *.js, which you would like to record.

8. Right click on “HTTP(S) Test Script Recorder” and add a listener: Add -> Listener –> View Results Tree

9. Return to HTTP(S) Test Script Recorder, and click the “Start” button at the bottom.
This will start the JMeter proxy server which is used to intercept the browser requests. A file called ApacheJMeterTemporaryRootCA.crt will be generated in jmeter/bin folder. Install this certificate in your browser.
Note: If you browser already uses a proxy, then you need to configure JMeter to use that proxy before starting JMeter, using the command-line options -H and -P.
Configure Firefox To Use JMeter Proxy
We will use Firefox as our browser when using the JMeter HTTP(S) Test Script Recorder because, unlike Chrome and some other browsers, it does allows you to override system-wide configuration for its proxy settings.
Configure Firefox to use localhost (127.0.0.1) on port 8080 as its proxy for all traffic by following these steps:
- Open Firefox
- Go to the Preferences menu
- Click on the Advanced tab
- Then Network tab
- In the “Connection” section, click on “Settings…”
- Select the “Manual proxy configuration” radio button
- Set HTTP Proxy to “localhost” and Port to “8080”
- Check “Use this proxy server for all protocols”
- Click OK and exit the Preferences menu
Note: When Firefox is configured to use JMeter’s Script Recorder as a proxy, it will only work properly if the Script Recorder is running.
Recording HTTP Requests
Now that our test plan’s HTTP(S) Test Script Recorder is running, and Firefox is configured to use it as a proxy, the HTTP requests that Firefox sends will be recorded. Let’s test it out.
In Firefox, go to your server’s homepage (the same server that you configured in your JMeter HTTP Request Defaults):
http://your_domain.com/
Now there should be a little triangle next to your Recording Controller. Click on it to expand and show the requests that it has recorded. You should see the HTTP requests that were recorded, depending on which URL Patterns you have included and excluded. Feel free to browse your site to record more requests.
As you can see, a lot of requests were created. You may refine the list of HTTP requests by simply deleting unwanted entries here.
If you do not see any entries under your Recording Controller, you will want to review your URL Patterns in the HTTP(S) Test Script Recorder (Hint: Remove all includes and excludes to record everything).
Once you are done recording, click the “Stop” button at the bottom of the HTTP(S) Test Script Recorder window. Note that Firefox will no longer be able to reach any pages (because it is configured to use port 8080 as a proxy)–configure it to use “No proxy” if you want to function normally.
Run Your Test Plan
Once you are happy with the test plan you have recorded, save it, then run it. It will function exactly like a manually created test, so you can configure it, delete, and add items to make it match your desired test case more closely.